WisDOT Crash Statistics Dashboard
Shiny
Data Viz
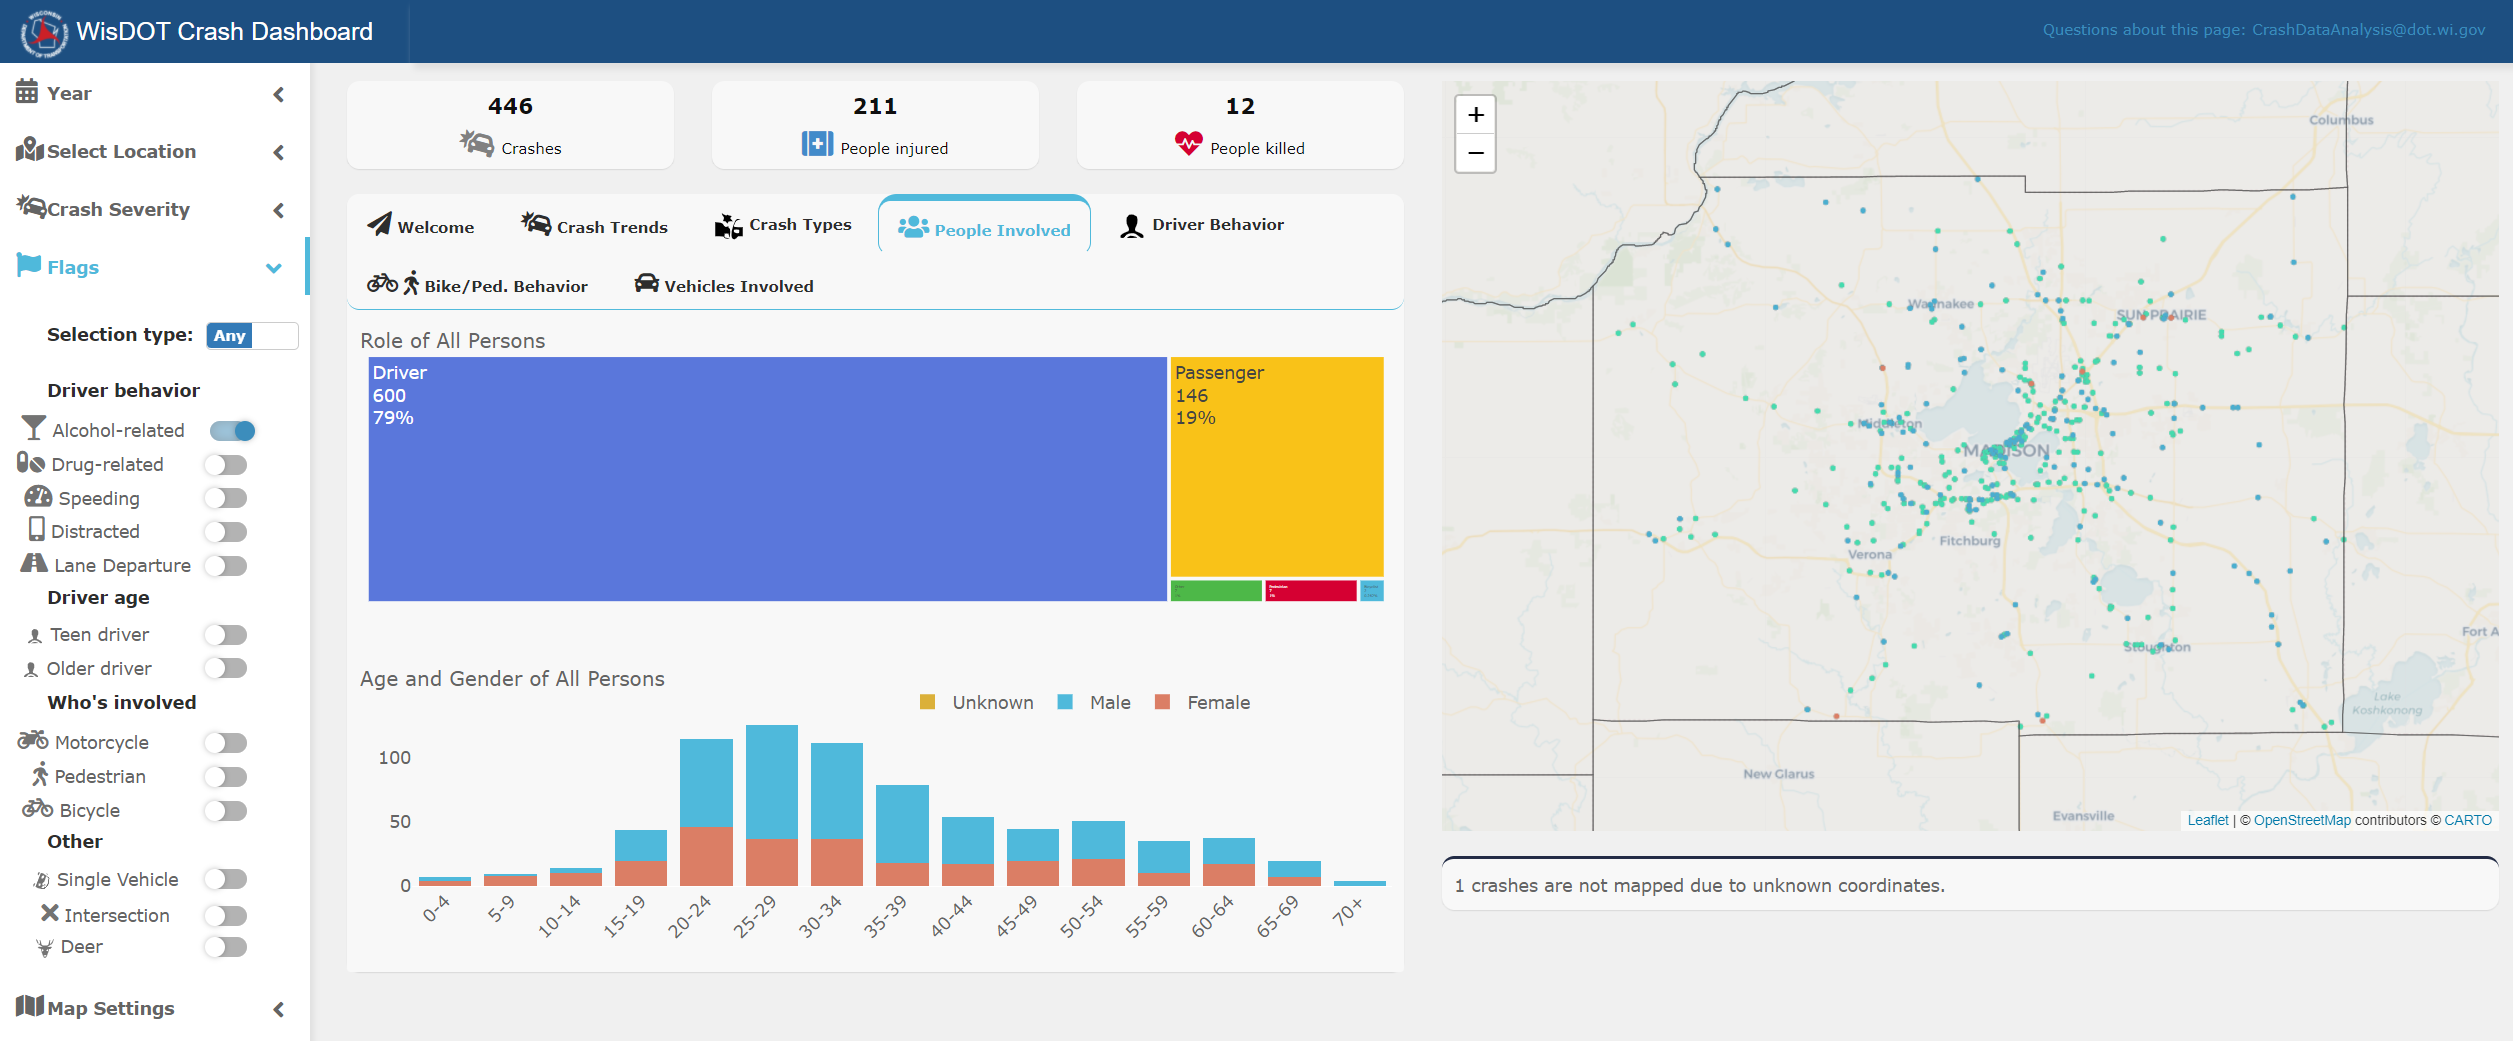
WisDOT uses Community Maps, a website that displays a map of crashes in near real-time. I wanted the user to have a visual of the data but with the same features and filters.
What I learned
Through performance testing via shinyloadtest, I found an enormous bottleneck through simply loading the data. As a solution, I created a SQLite database as the database is saved locally inside the package. While this dramitically improved performance, data was still being mapped on-the-fly. Ideally the data should be stored in a spatial database. This app also uses modules so server and ui are much cleaner while the code is easier to debug.
Highlighted packages
The dashboard uses plotly, leaflet, leaflet.extras2 and leafgl under a golem framework.